Reading the Grid#
The baseball scorecard looks intimidating the first time you see it — a dense grid of boxes covered in numbers, letters, and cryptic symbols. But the underlying structure is simple and logical once you know the key. Every box in that grid tells the story of one at-bat, and together they tell the story of the whole game.
The Basic Layout#
The scorecard grid works like a spreadsheet with baseball rules:
- Rows represent batters, in lineup order. The leadoff hitter is row one, the cleanup hitter is row four, and so on through the ninth spot.
- Columns represent innings. The first inning is the leftmost column, the ninth (or later) is to the right.
- Each cell represents one plate appearance — one at-bat — by that batter in that inning.
To follow the game, you read down the first column for the first inning, then down the second column for the second inning, and so on. When the lineup turns over — when you get back to the top of the order — you continue from where you left off.
What Goes in Each Cell#
Each cell captures the full story of one plate appearance:
- Mini diamond — shows where the batter went on the bases (or didn’t). Heavy blue lines trace the path the runner took; a filled interior means they scored.
- Fielding notation — the out or hit notation, using fielder numbers. A 6-3 is shortstop to first base. An F8 is a flyout to center. A “1B” is a single.
- Pitch dots — small colored dots showing each pitch in the at-bat (balls, strikes, fouls).
- Out indicator — a small circle in the cell that gets filled or annotated when the batter is retired.
- RBI dots — small marks indicating how many runs batted in the batter earned on this play.
See the Scoring Notation page for the full notation reference, and the Mini Diamond page for how to read the base path diagrams.

Following the Game Flow#
Reading a scorecard isn’t just scanning one row or one column — it’s following the game as it unfolded. Here’s how:
- First inning, top half: Start at row 1, column 1. Read down until you see three outs marked. That’s the end of the half-inning.
- First inning, bottom half: If you’re scoring both teams (two separate grids), move to the other team’s grid. If you’re doing a combined grid (less common), continue on the same sheet.
- Second inning, top half: Move to column 2 and read down again. The at-bats continue from wherever the lineup left off — if the third batter made the last out in the first, the fourth batter leads off the second.
The lineup doesn’t restart at the top each inning. It’s continuous. The lineup order is your constant; the inning columns just mark time.
Lineup Wraparound#
A lineup has nine batters. In a long inning, the batting order can turn over — the ninth batter makes out, and then the first batter comes up again in the same inning. On the scorecard, this means you’ll see the same player’s name appearing again — in a second column for that inning, or in a second row below their first row, depending on the scorecard format.
Some scorecards handle this by leaving space for extra at-bats in each column. Others use a separate column for “second time through.” Either way, the principle is the same: follow the order, and mark each at-bat as it happens.
Substitutions and Lineup Changes#
When a player is substituted out, their row ends. The new player either takes over the same row (written below the original name) or gets a new row, depending on the scorecard format. A vertical line marks where the substitution happened.
For full details on substitution notation, see Substitutions.
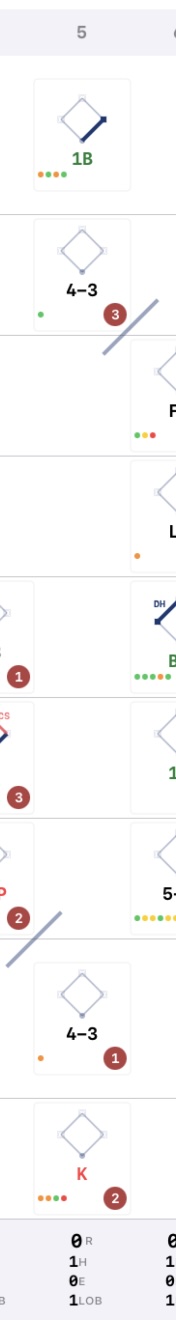
The Inning Totals Row#
At the bottom of each inning column, you’ll typically find a summary row showing:
- R — Runs scored this inning
- H — Hits recorded this inning
- E — Errors committed this inning
- LOB — Left on base at the end of the inning
These per-inning totals are what feeds the Line Score — the big-picture summary across the top or bottom of the scorecard.
The lineup wraparound screenshot above also shows the inning totals row at the bottom — R, H, E, and LOB for that half-inning.
In BaseballScorer#
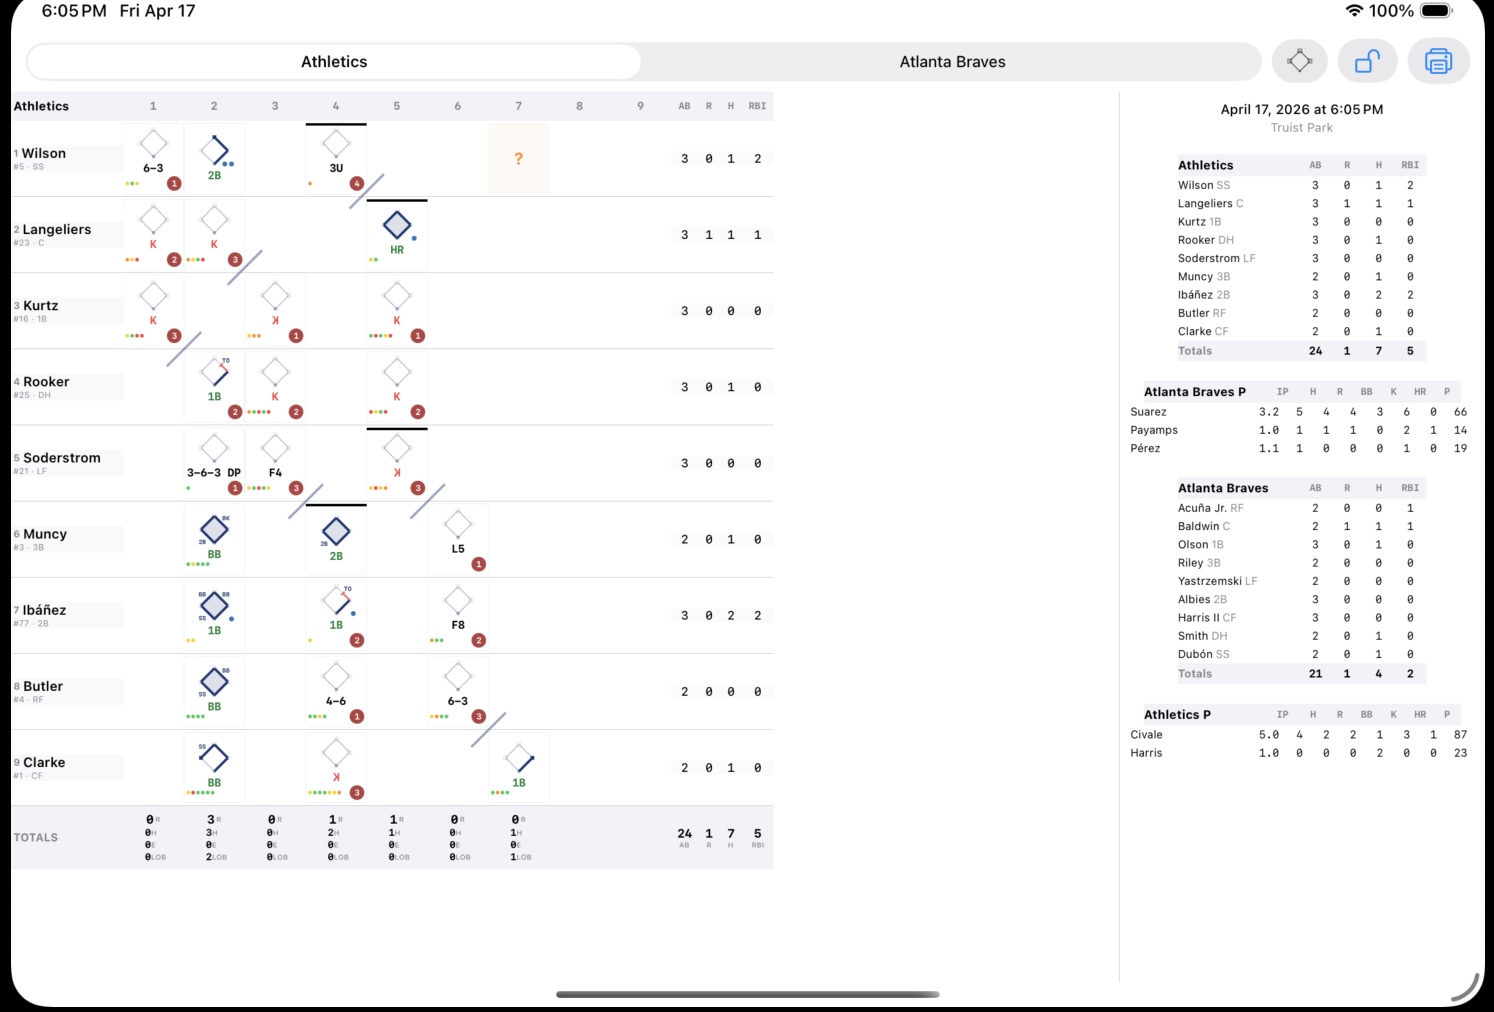
In BaseballScorer, the full scorecard grid is visible in landscape orientation. Rotate your iPad sideways and the scorecard appears, with:
- Player names in a column on the left
- Inning columns scrolling horizontally
- A stats column on the right showing AB/R/H/RBI totals per player
- An inning totals row at the bottom
The header row (inning numbers), player rows, and totals row are all part of a single shared horizontal scroll — so everything moves together when you swipe left or right. You’ll never have a misaligned header.
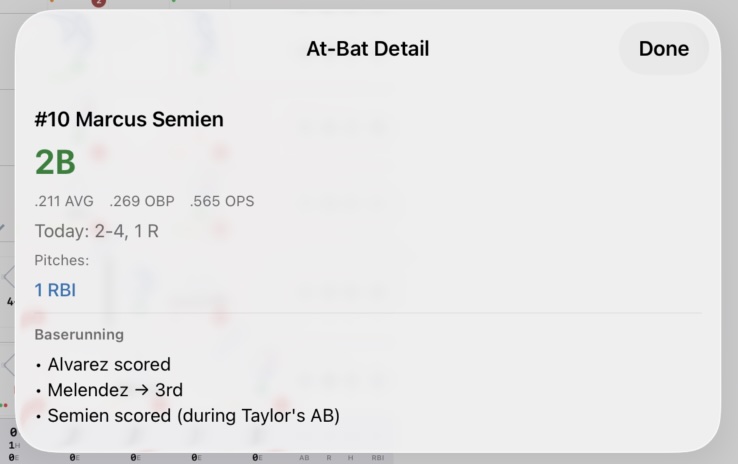
Tap any cell to open a detail popup with the full at-bat breakdown — pitch sequence, fielding notation, base paths, and any notes. This is useful for reviewing what happened in a specific at-bat without scrolling through the inning summary.
Each cell contains a miniature version of all the same elements: mini diamond, fielding notation, pitch dots, and out/RBI markers. Overlays like pitching change lines (horizontal), substitution lines (vertical), inning-end diagonal slashes, and ghost runner cells provide additional context directly on the grid.
The scorecard is a read-only view — you score from the portrait view, then review in landscape. But because every at-bat is stored as structured data, the grid always reflects the current game state accurately.
See also: Mini Diamond | Line Score | Scoring Notation | Substitutions